

A comprehensive evaluation and revamp of QuickBooks’ Payroll product that equips business owners with clarity & confidence to manage their payroll data.

Intuit Canada
QuickBooks Online Payroll (QBOP) Canada
Team: Sanjay Sen, Marieta Shanouda
Role: Interview guide, Facilitating/Scheduling/Leadings user sessions, Mock ups, Prototyping, Research synthesis, Presentation
Tools: Sketch, InVision
Context & Background
QuickBooks Online Payroll (QBOP) is a software that helps small business owners run their businesses smoothly by managing their business accounting and payroll.

During my 4-month co-op term at Intuit Canada, my area of focus was on the Employees section of QuickBooks (Canadian product). According to a survey conducted with over 1,300 QBOP customers, nearly 50% of respondents stated that they accrue vacation for their employees. However, currently the Employees section of QBOP does not address vacation accrual.
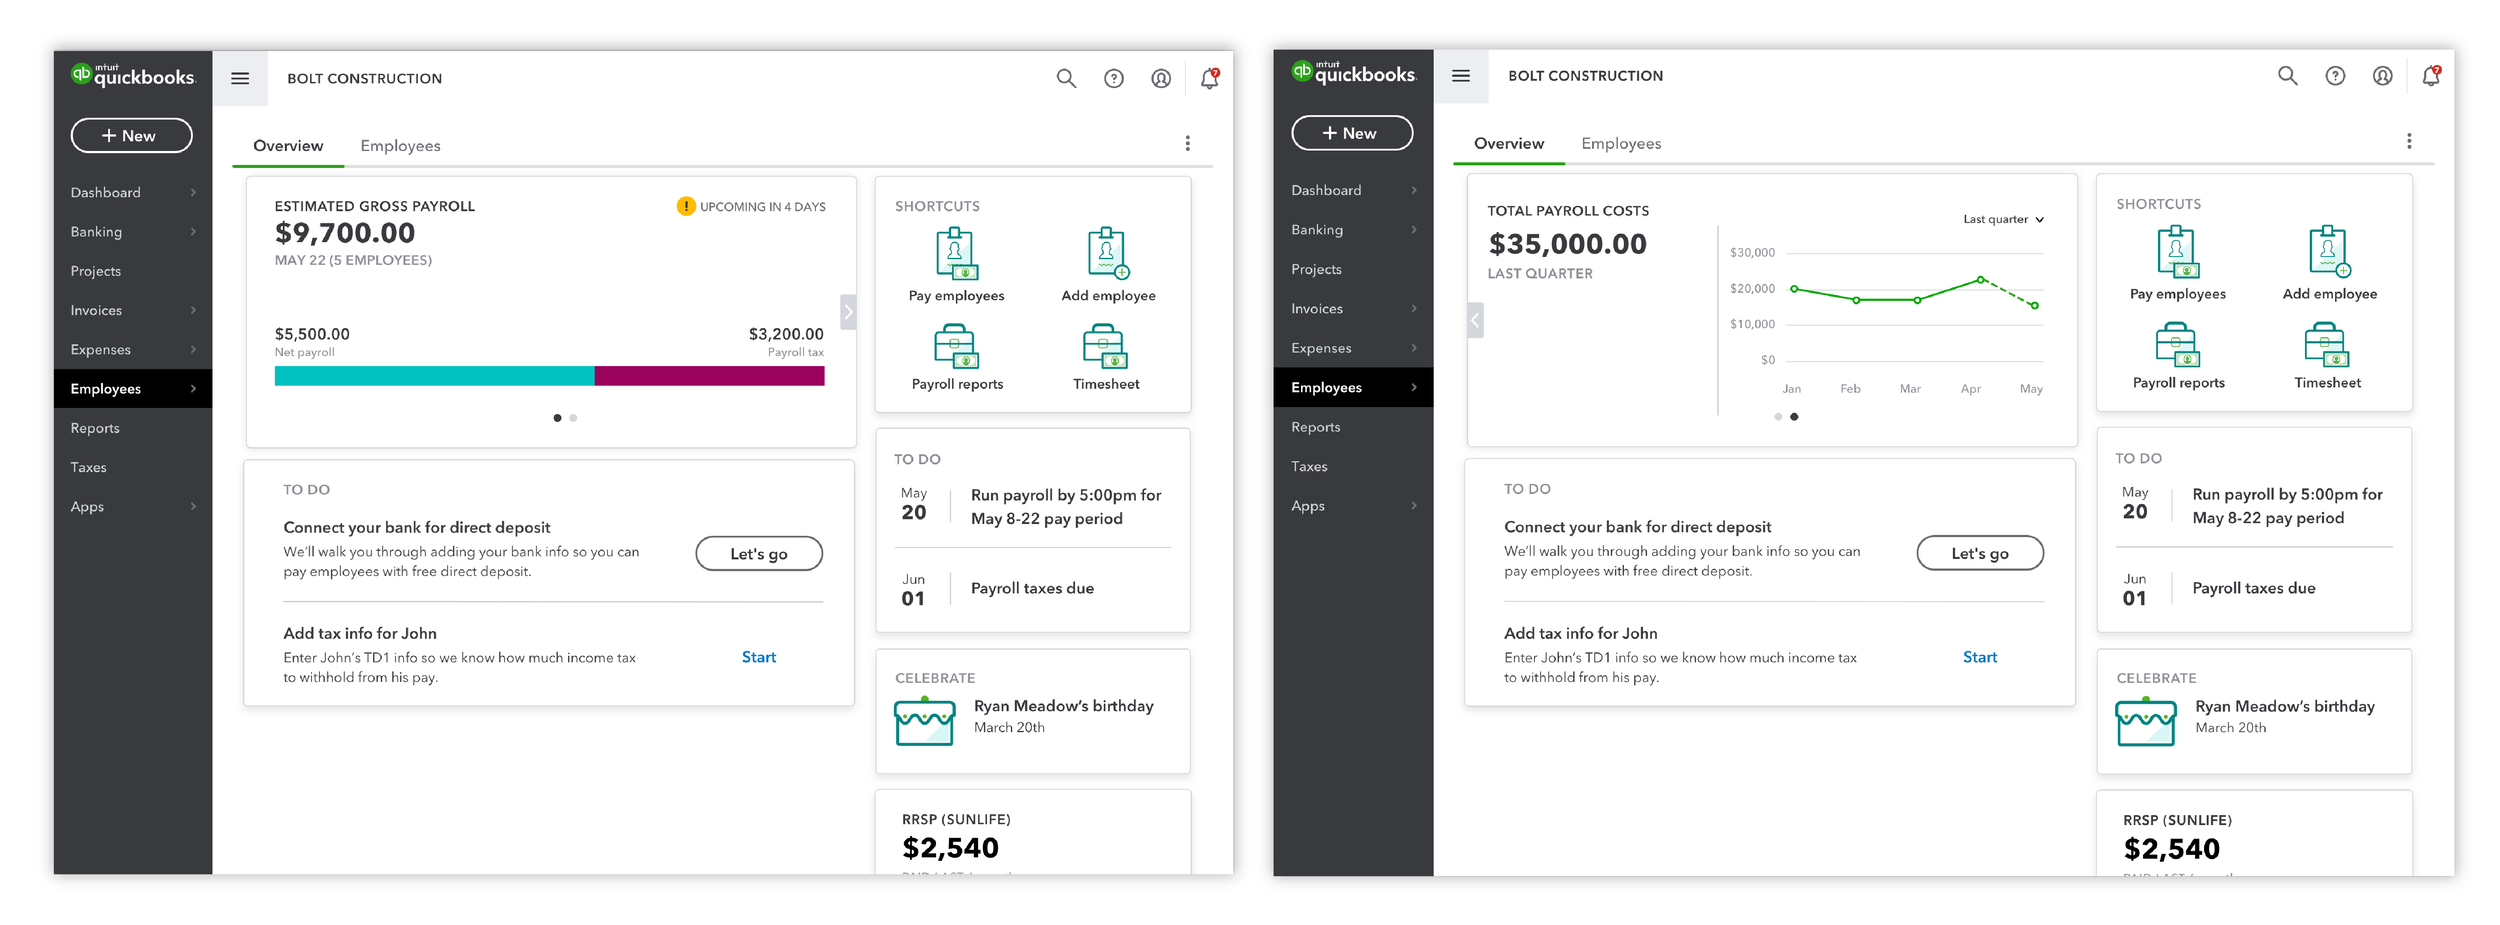
My aim was to explore and influence the Employees section of QBOP Canada while considering the impact of showing vacation accrual. The Employees section is where small business owners access employee data and run payroll every pay period.

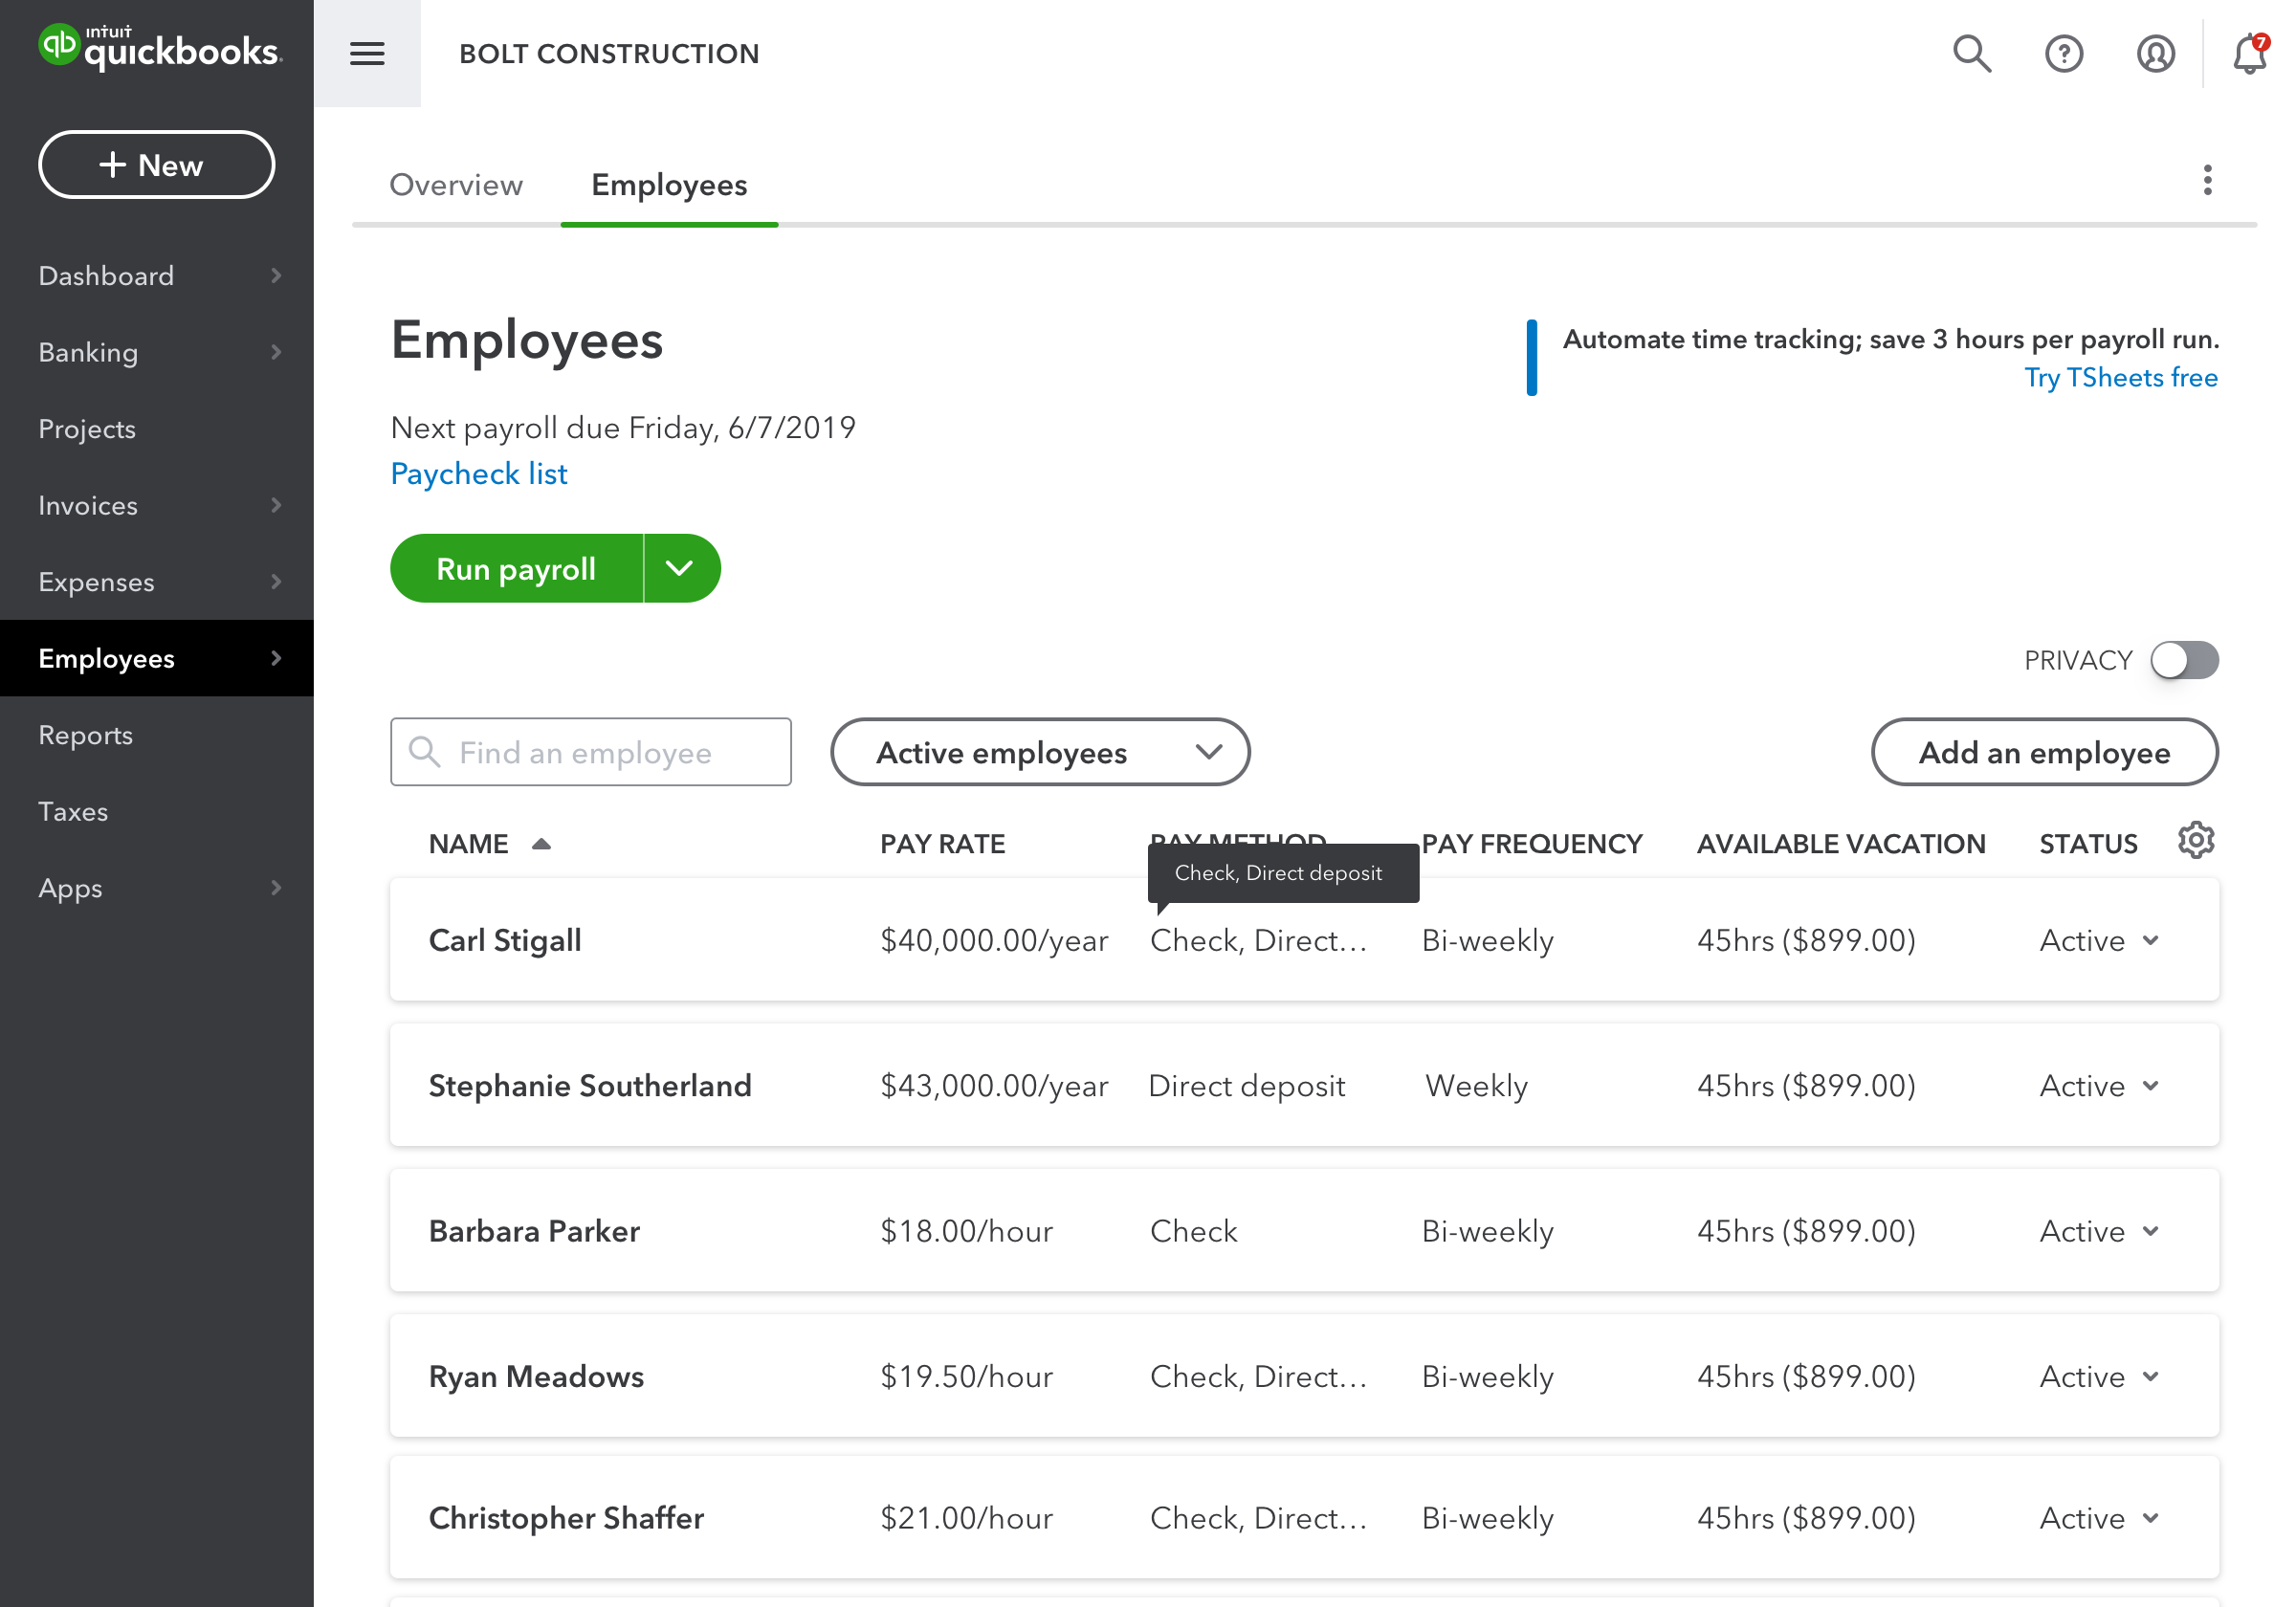
Current Canadian Employees List page

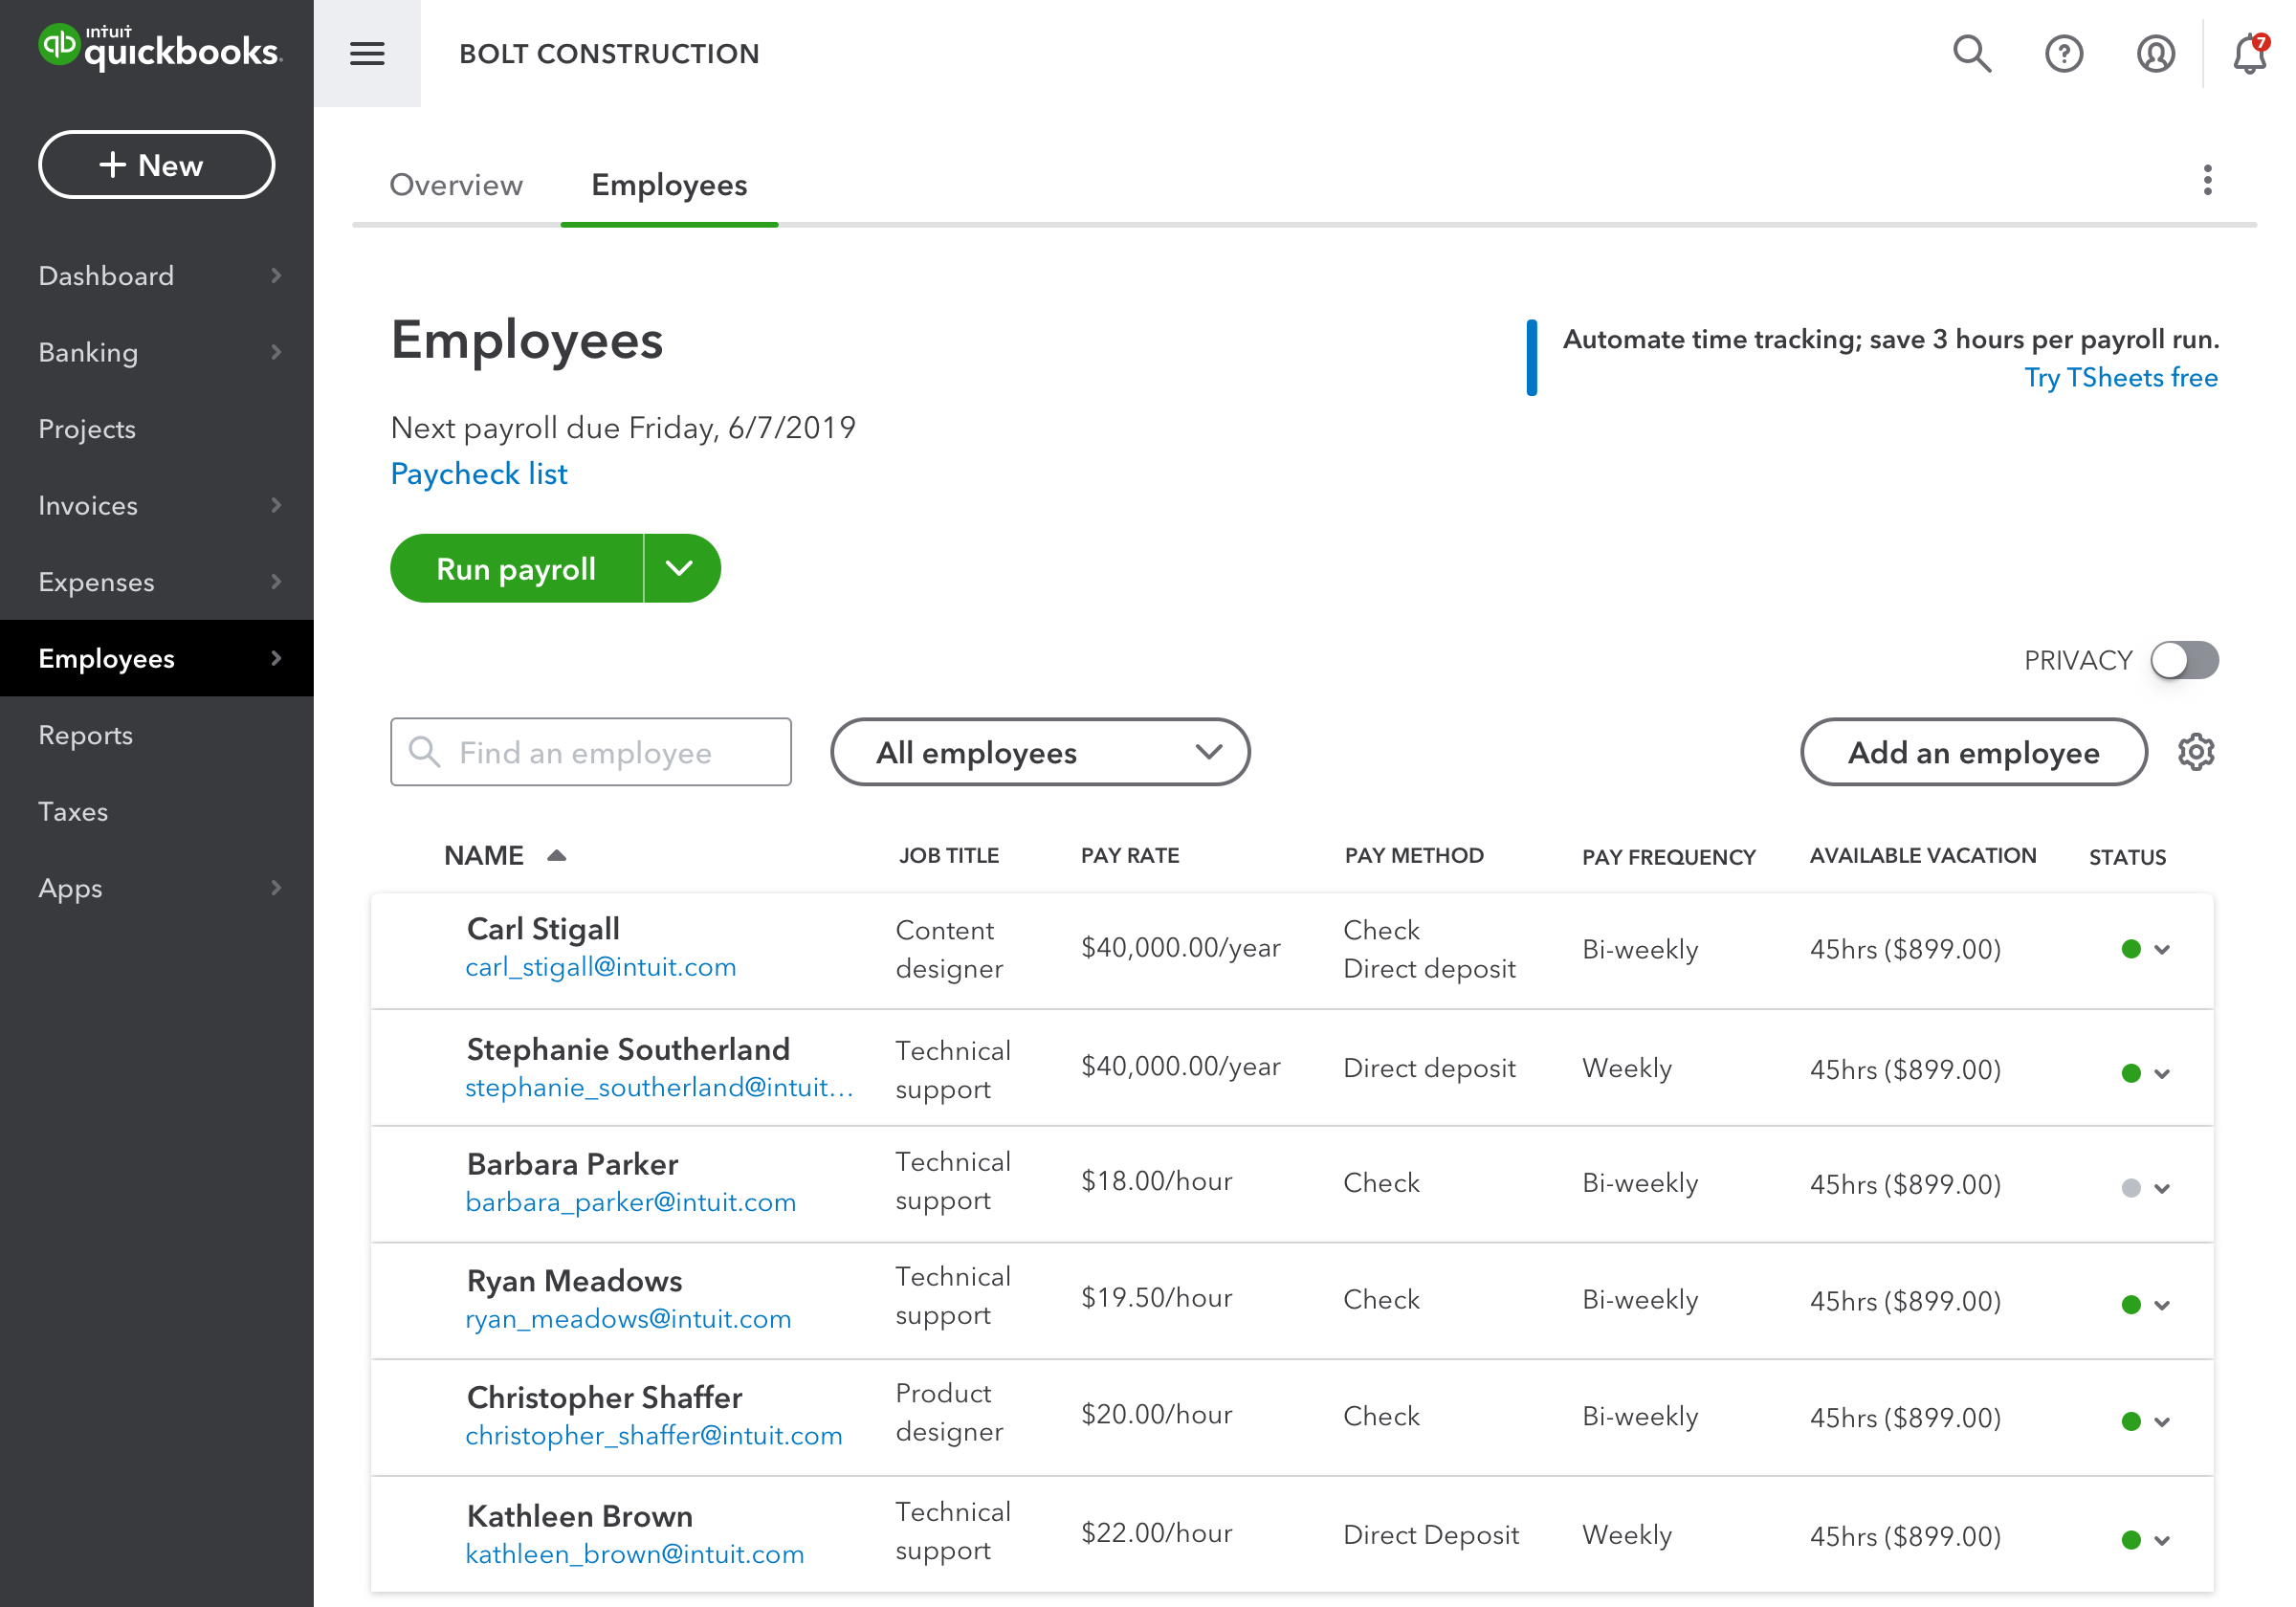
US Employees List card implementation
Objectives
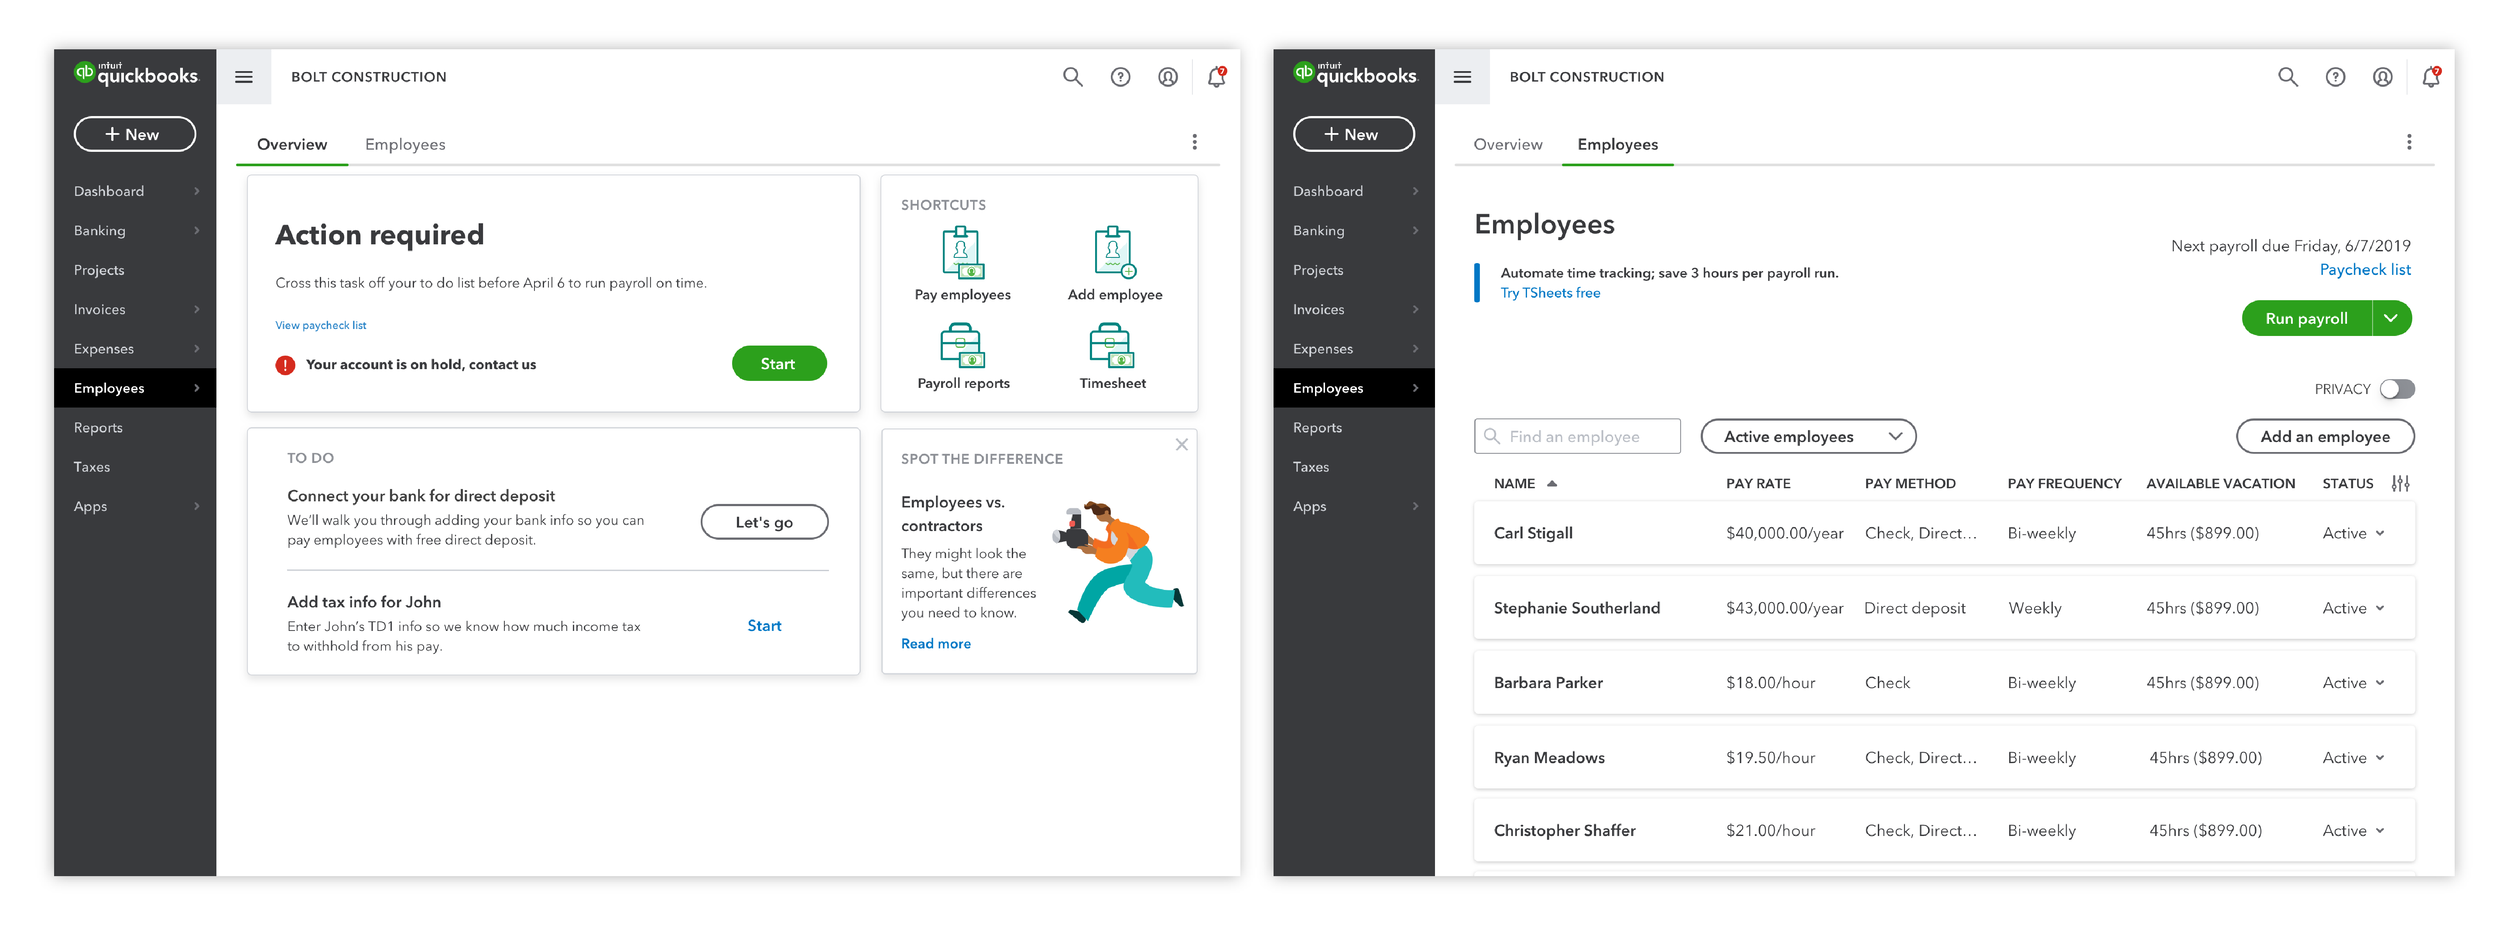
There were 2 parts of the QuickBooks Payroll product to explore: (1) Employees List and (2) Overview Dashboard.
1) Employees List: Test & influence the US implementation, exploring the scalability of a card design with multiple columns.
The QuickBooks US team has a card-based implementation for the Employees List page with a focus on the US market. However, it does not take into account each employees’ vacation accrual in Canada. Concept tests were used to identify the type of information users would prioritize and to learn about the cases when customers may need to access the Employees list.
2) Overview Dashboard: Explore & gain insights on a proposed Overview Dashboard in order to provide Canadian customers with quick, accessible data about their payroll at a glance. We were interested in discovering how a dashboard could work in conjunction with the Employees list, and to understand what types of data is most relevant to Canadian customers from a payroll perspective.
Process

Timeline of my progress during my 4-month co-op term
Part 1: Employees List
Card-based design explorations


Round 1 - Concept Testing User Sessions
I created 7 exploratory designs to explore how we might present the Employees List with additional columns and types of information listed (such as job title, vacation accrual, contact info, etc.). Upon presenting and discussing with the rest of the UX design team, I was able to narrow down on 3 explorations to take to the first round of user sessions.
My team and I spoke to 7 participants: 6 small business owners, and 1 accountant over the course of a week. The criteria for participants required them to already be existing QuickBooks Online Payroll (QBOP) customers that have a mix of salaried and hourly employees and have between 4-15 employees. We wanted to understand how feedback may vary depending on the number of employees a business has. For example, how users might perceive the Employees List if they have 5 employees versus if they have 10 employees that goes beyond “the fold”.
Employees List: Learnings

(1) The type of information small business owners (SBOs) are interested in seeing is dependent on the size of their business.
Leveraging the employees’ job title and email is not relevant to them because they know their employees well enough and store phone numbers on their phone. Customization of columns will allow for an added value of customization and flexibility for each business’ unique needs.
“I could care less about the job title because I know what everybody’s job title is and I don’t really need to see that.”
(2) SBOs want to be informed of how many hours they tracked for each employee as well as the year-to-date for each employee.
Especially when they may be paying a lot of money for very little sales, they want to know how their payroll costs look like in relation to their business growth.
“I’m paying a lot of money for very little sales. I always like to know how much I put out. I know how much I’m bringing in, but I don’t always know how much is going out the door.”

(3) There is value in showing outstanding hours and dollar amount for each employees’ vacation accrual.
“I have a spreadsheet [to track available vacation], just because it was more challenging to look at it quickly in QuickBooks and find it so I just decided I would keep my own spreadsheet.”
Part 2: Overview Dashboard
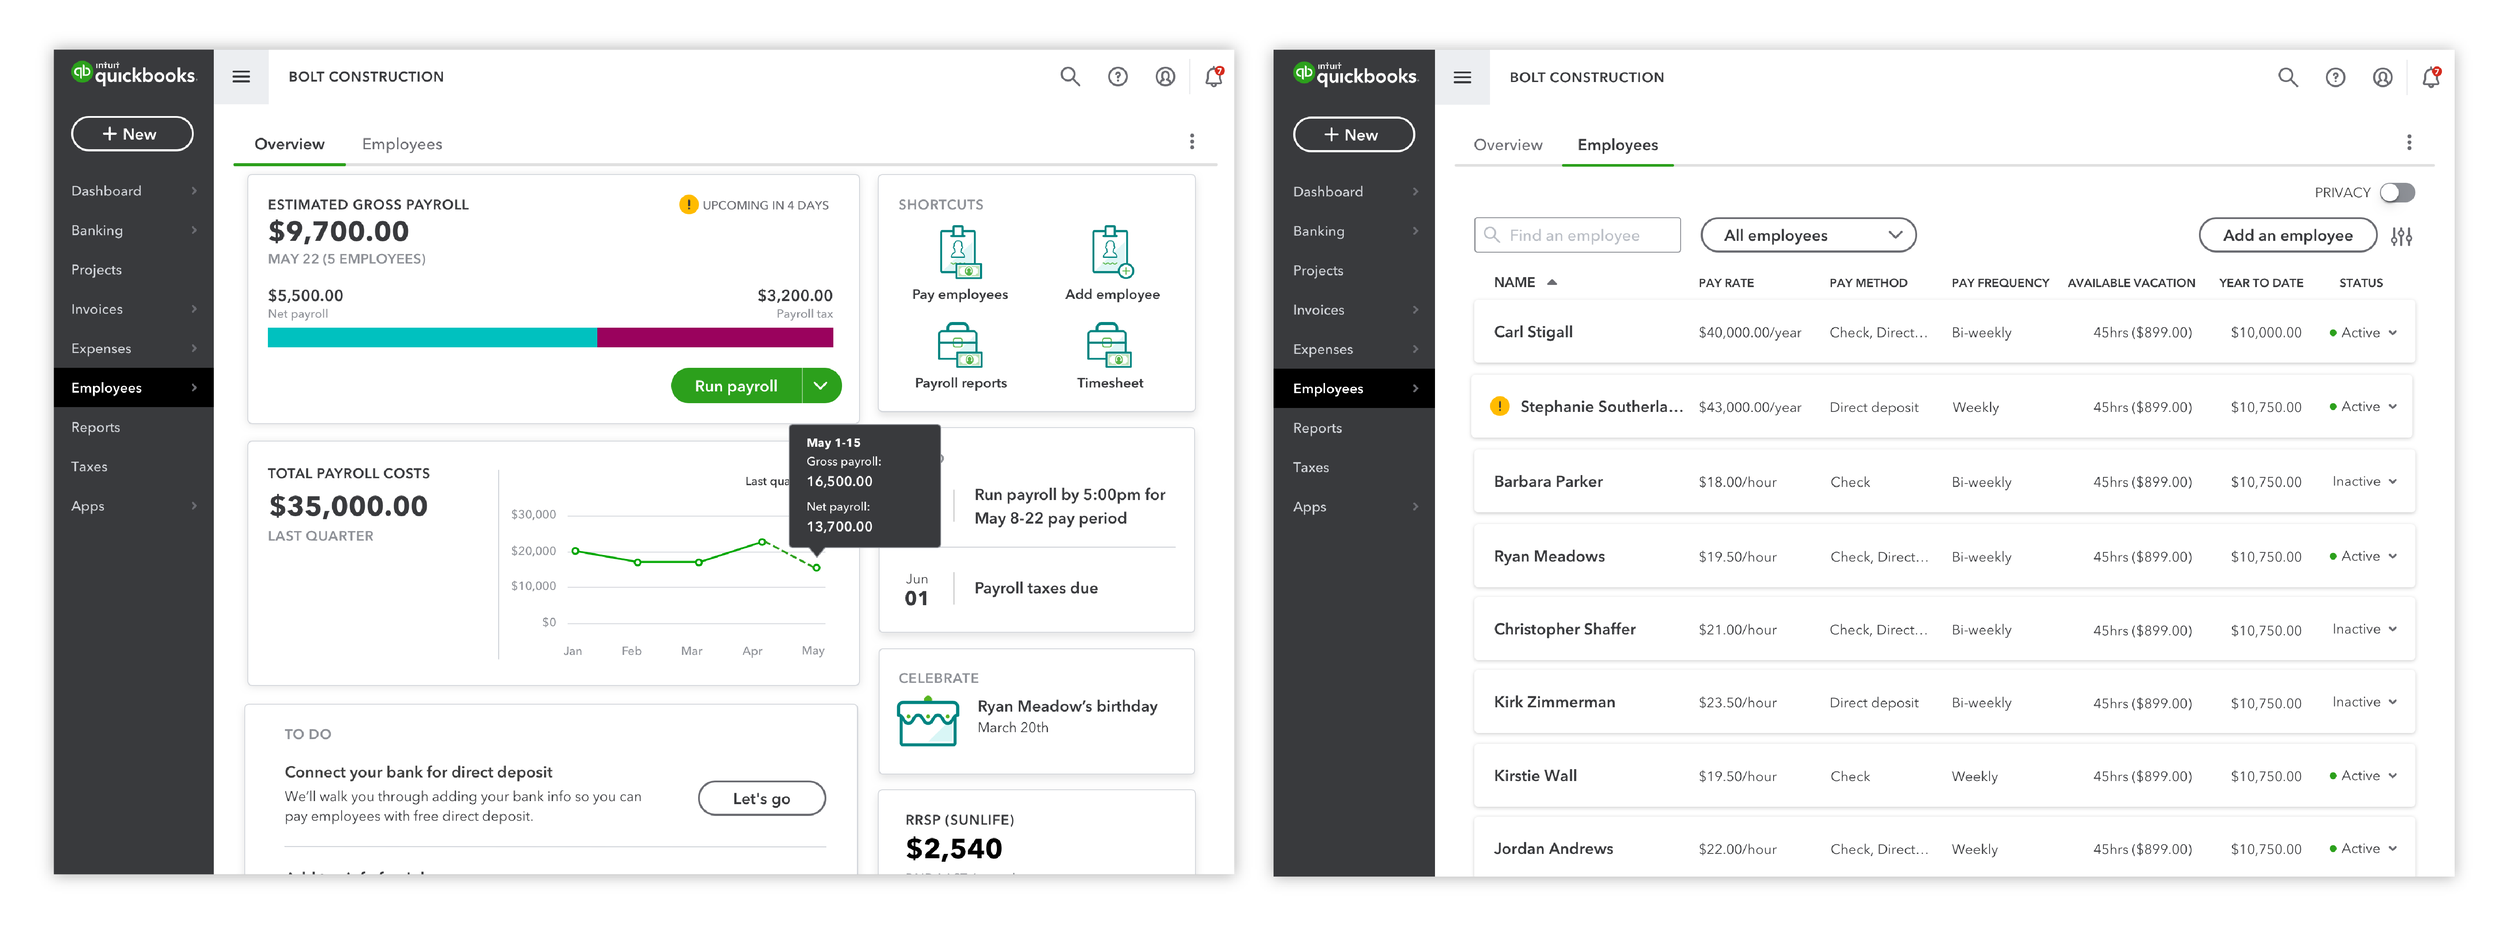
Overview Dashboard Explorations
The following designs are explorations for an Overview Dashboard that would be implemented in conjunction with the existing Employees List (from Part 1). Particularly, we wanted to gather feedback from Canadian QBOP customers on:
(1) the type of data customers want to see at a glance from a payroll perspective
(2) where they would expect to be able to run payroll from (Overview Dashboard vs Employees List)

Round 2 - Concept Testing User Sessions
I took responsibility for organizing and planning the second round of user sessions for the Overview Dashboard — which we spoke with 7 existing QBOP customers.
(1) I sent in requests and participant criteria to the recruiter two weeks prior to kicking off the sessions, and sent invites for each session to my team members (quality analysts, content designer, project manager, senior designer).
(2) I created a Learning Plan document outlining the purpose and goals of the research study, linking the prototypes, listing questions to cover, and insights we want to learn. In order to ensure accountability and that the rest of my team members stay in the loop, I shared the Learning Plan with them to review before each user session.
(3) Because I didn’t have much experience leading user sessions and taking full ownership of them, I created a rough User Session Guide for myself to follow and ensure that the sessions would not surpass the intended time slot. This proved to be useful as the sessions all finished on time and my team members who sat in the sessions praised my ability to lead the sessions organically and professionally.
(4) Following the user sessions, I compiled my team members’ notes from each session into a presentation that summarized the learnings from both rounds of user sessions (the Employees List and Overview Dashboard) which I presented to the Canada QuickBooks Payroll team. The presentation was focused on diving deep into the learnings and discoveries, which the team would take further past my co-op term.
Overview Dashboard Learnings
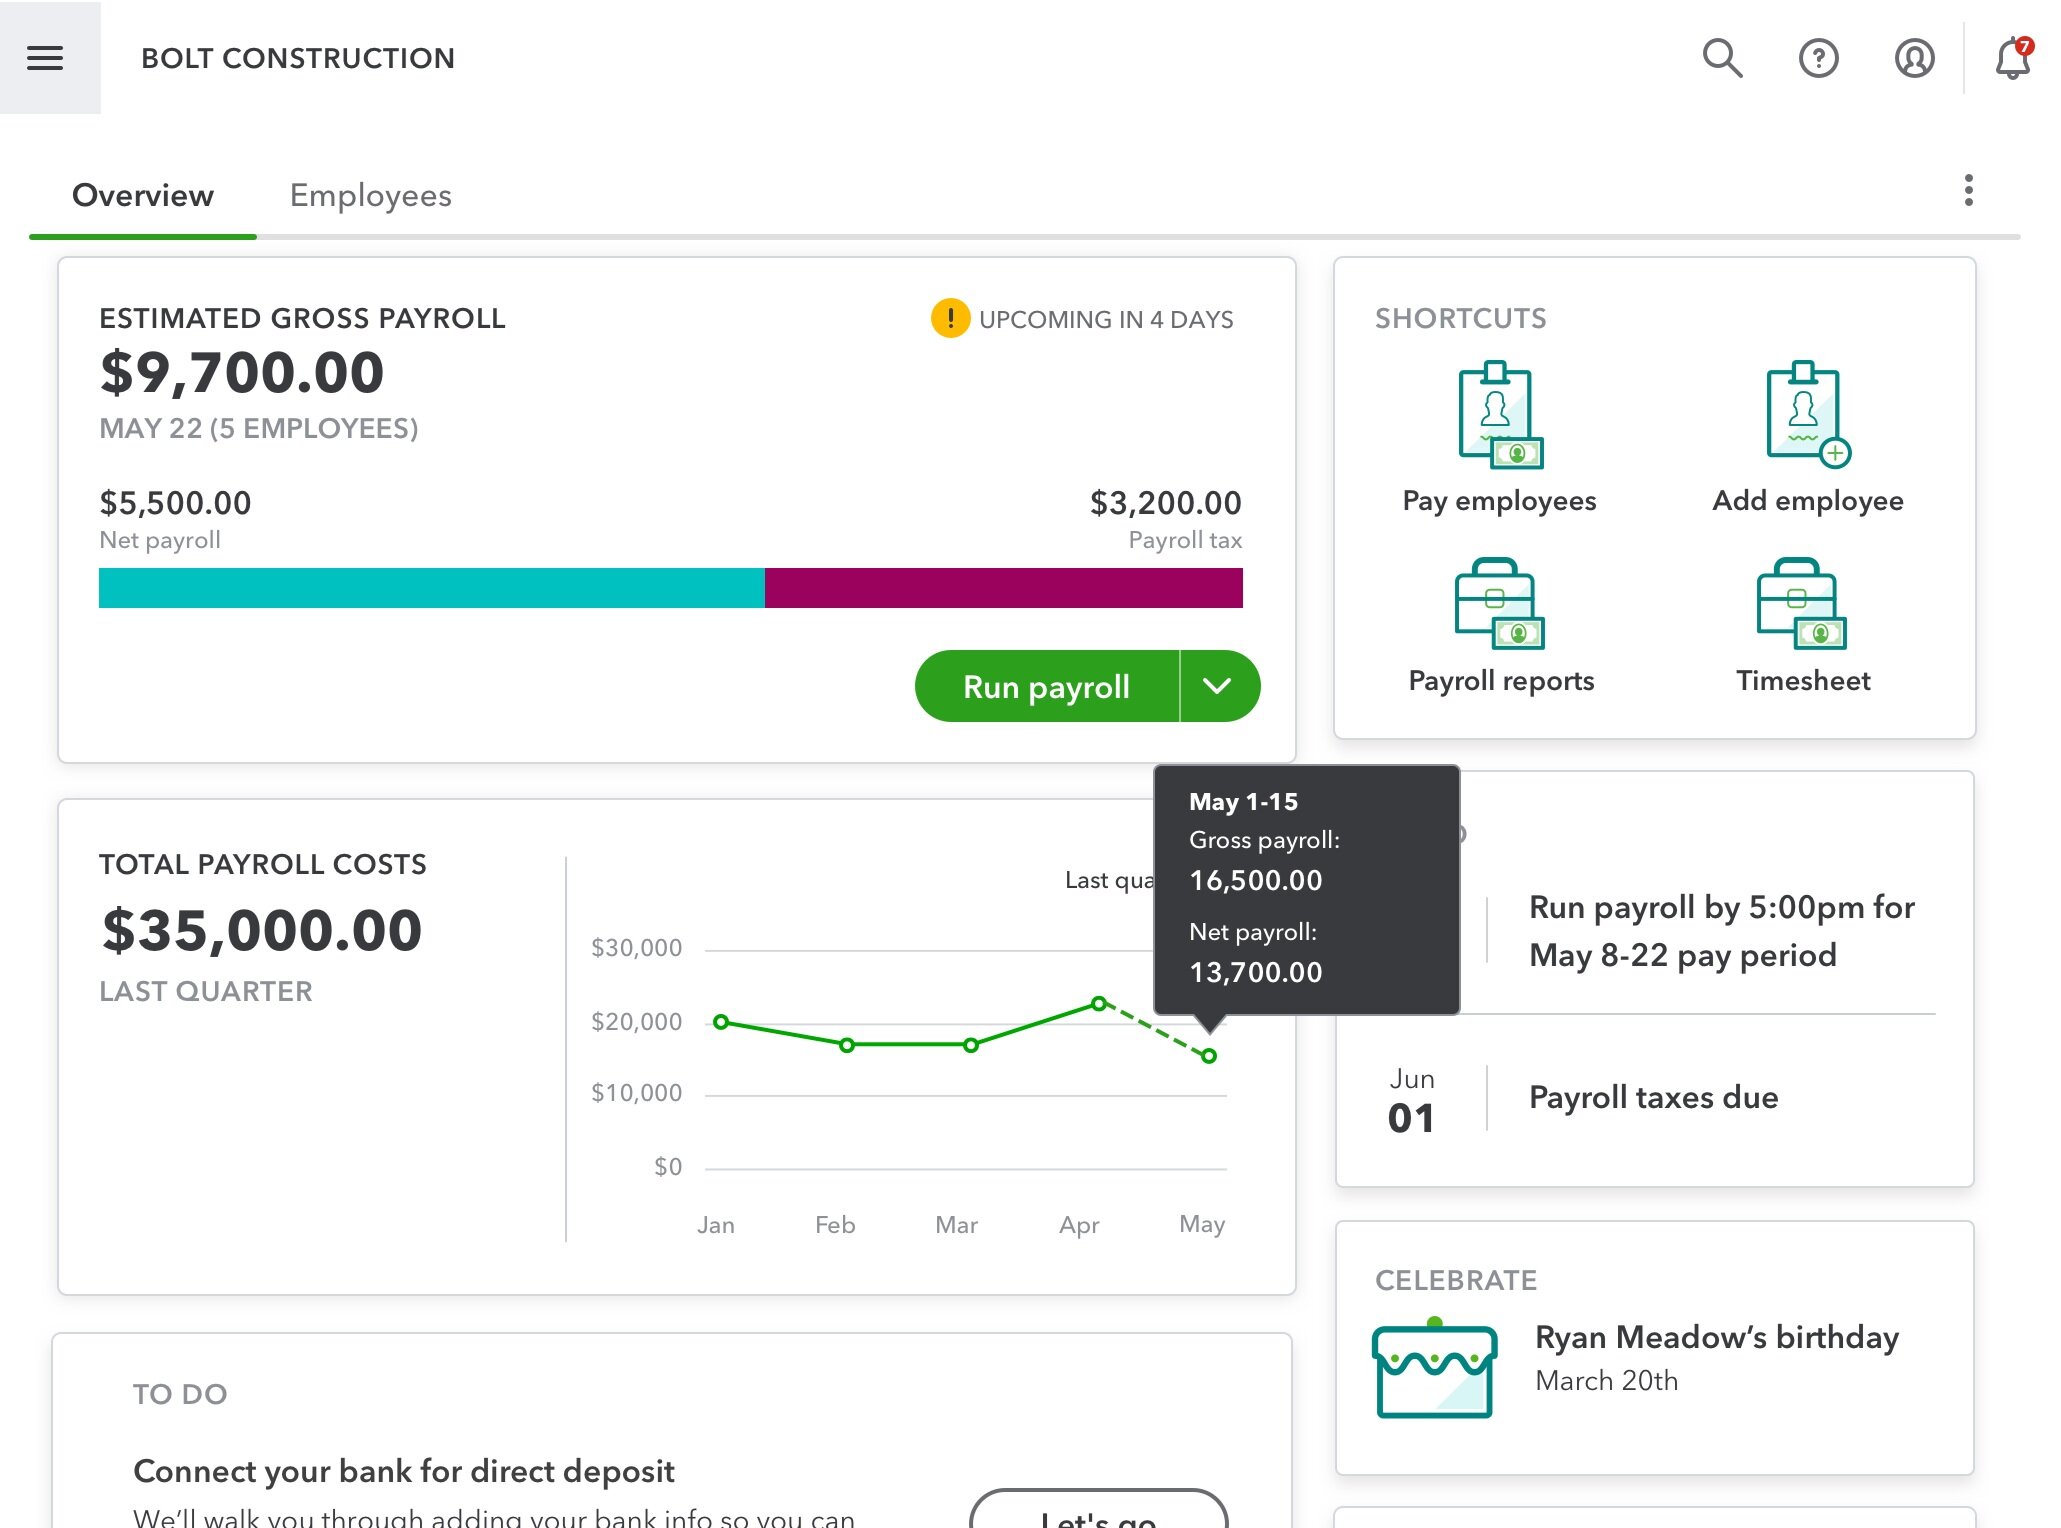
(1) Participants prioritize the Overview Dashboard and prefer to land on it every time they access the Employees section of QBOP, rather than seeing the Employees list.
The convenience of being able to quickly see payroll data about their business at a glance (rather than the consolidation of data into a carousel) helps them understand their business better. As well, they prefer to see the option to Run Payroll in the Overview Dashboard. They want to be able to access data in the fewest number of clicks.
“I usually have too much to do and I don’t always get to looking at the numbers and figures, which is why these charts and graphs are useful for me. I really should be doing this stuff on a monthly basis and I don’t.”

(2) Accountants don’t find estimations helpful, but small business owners like to see it in order to have a rough idea of how much they’re spending.
An interesting insight my team and I discovered from speaking with both accountants and small business owners is that an estimation of numbers is a challenging space to navigate.
Accountants often don’t find the idea of estimations helpful because it’s not meaningful to be provided a number that is not finalized. Whereas small business owners like to see rough estimates in order to get an idea of how much they’re spending when they need to make big purchases.
“It’s just nice when I’m doing books in general and especially in cases like COVID, what were my payroll costs, how much do I have the next three months, how many expenses am I going to have and what’s my income going to look like... having it right there is quick and easy instead of having to run a report.”

(3) Participants mentioned that they prefer to see trends about their total payroll costs on a long-term basis.
They expressed interest in a comparison of month-by-month payroll costs or on a yearly trend, rather than seeing it on a quarterly basis in order to see the growth and state of their business.

(4) Birthday and work anniversary reminders are an added value so employers can show that they care about their employees.
Small business owners expressed that they want to be able to celebrate their employees’ birthdays or work anniversaries because they offer days off or an increase in vacation days.
(5) Because payroll is a huge expense to small businesses, presenting useful tips and strategies to help them save money is another added value.

FROM: Current Canadian product - Employees section of QBOP

TO: Exploration - Overview Dashboard section of QBOP
Reflection

The biggest challenge for me involved stepping out of my comfort zone — I was responsible for organizing, planning and leading seven user sessions for the Overview Dashboard. I especially was not comfortable with leading each session in fear that I would be awkward and wouldn’t be able to maintain an organic conversation going.
I acknowledged the feelings of incompetency and anxiety, and to cope, I created a learning plan document and a User Session Guide to help me with leading questions. I started to feel more comfortable and confident in myself after the first three sessions — in which I found that I didn’t have to refer to my guide as thoroughly and conversation came more naturally.
Through my work performance, my supervisor was impressed with my self-awareness and willingness to take on challenges, as well as my ability to juggle multiple streams of work at once.